

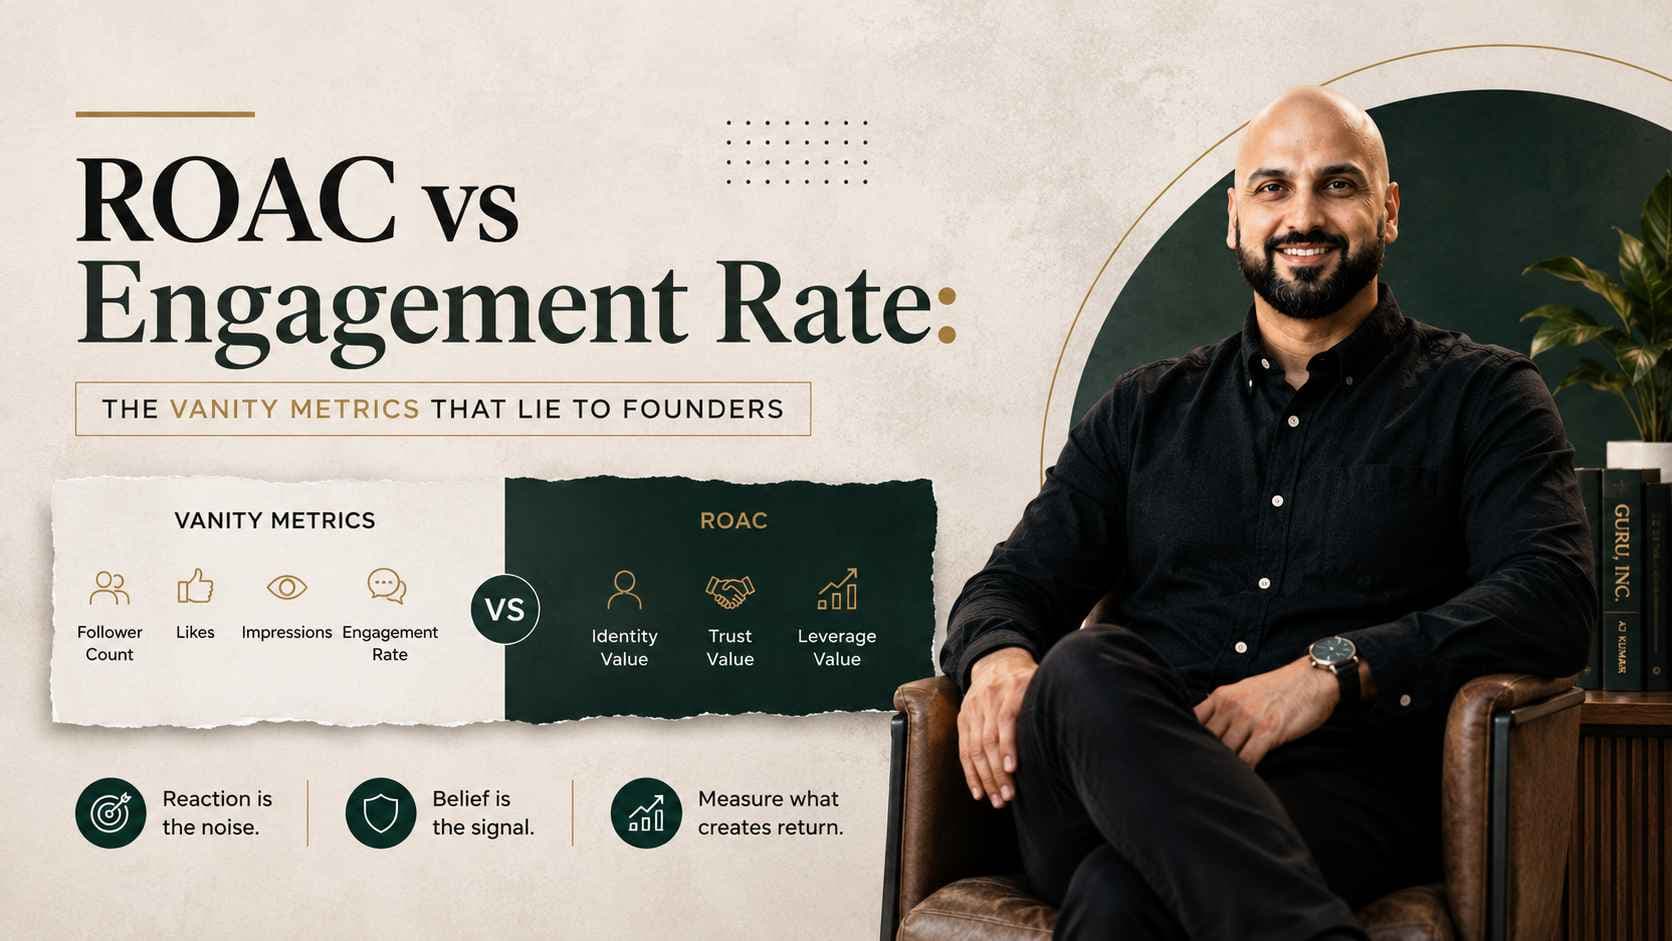
Founders run their content engines on dashboards full of followers, likes, impressions, and engagement rates, and every one of those numbers climbs without a single dollar moving. The correlation data below ends the argument, and the replacement takes three questions.
Key Takeaways
Engagement rate divides reactions by followers, which measures platform behavior and predicts nothing about purchase behavior.
The Cirqle measured the correlation between follower count and campaign return across its own data: 0.04, statistically near zero.
In the same dataset, a creator with 22,000 followers returned 20x. A creator with 631,000 followers returned 2.7x.
Every vanity metric shares one flaw: the number rises on attention that creates no identity, no trust, and no leverage value.
ROAC, Return on Attention Created, replaces the dashboard with three banked outcomes: association, action, and compounding inbound.
Reaction is the noise. Belief is the signal.
Engagement Rate Measures the Audience's Thumbs, Not Its Wallet

Engagement rate is a fraction: reactions plus comments, divided by followers or reach. The number reports how often an audience performs the cheapest actions a platform offers.
Founders read it as proof of connection. "Our engagement rate is up 40 percent this quarter" sounds like growth, and the sentence describes thumbs, not wallets.
The metric was built by platforms, for platforms. High engagement tells an algorithm to distribute more, so the number genuinely matters inside the feed.
The mistake is carrying it outside the feed. A buyer who taps a like has invested half a second and zero judgment.
A buyer who books a call has invested trust. Engagement rate counts the first behavior and stays blind to the second, which is why more content and rising numbers produce no authority for founders who optimize the fraction.
The Correlation Data That Ends the Follower Argument
Follower count predicts campaign return at nearly zero, and the measurement comes from an industry player with every incentive to find the opposite.
The Cirqle, an influencer marketing platform, ran the correlation between creator follower count and campaign return across its own performance data. The score came back at 0.04, on a scale where 1.0 means perfect prediction and zero means no connection at all.
The individual cases make the number visceral. A creator with 22,000 followers returned 20x. A creator with 631,000 followers returned 2.7x. The small account outperformed the large one by a factor the follower counts predicted backwards.
Audience size and audience value move independently, and every founder dashboard treating them as the same number is reporting fiction.
The Comparison: Vanity Metrics Against ROAC
Six attributes separate the vanity dashboard from the ROAC judgment. The comparison is given below:
Attribute | Vanity metrics | ROAC |
Question answered | How much attention arrived | What the attention created |
Unit counted | Followers, likes, impressions | Identity, trust, and leverage value |
Gamed by | Trends, giveaways, bought reach | Nothing: outcomes resist inflation |
Predicts | Algorithm distribution | Pipeline and pricing power |
Decays | With every algorithm change | Compounds across quarters |
Serves | The platform's report | The founder's business |
The gamed-by row explains why vanity dashboards feel so good and pay so little. Every vanity metric inflates on demand: a giveaway buys followers, a trend buys impressions, a controversy buys engagement. Banked outcomes refuse inflation. Association, action, and inbound arrive only when the content earned them.
The Four Vanity Metrics and What Each One Hides
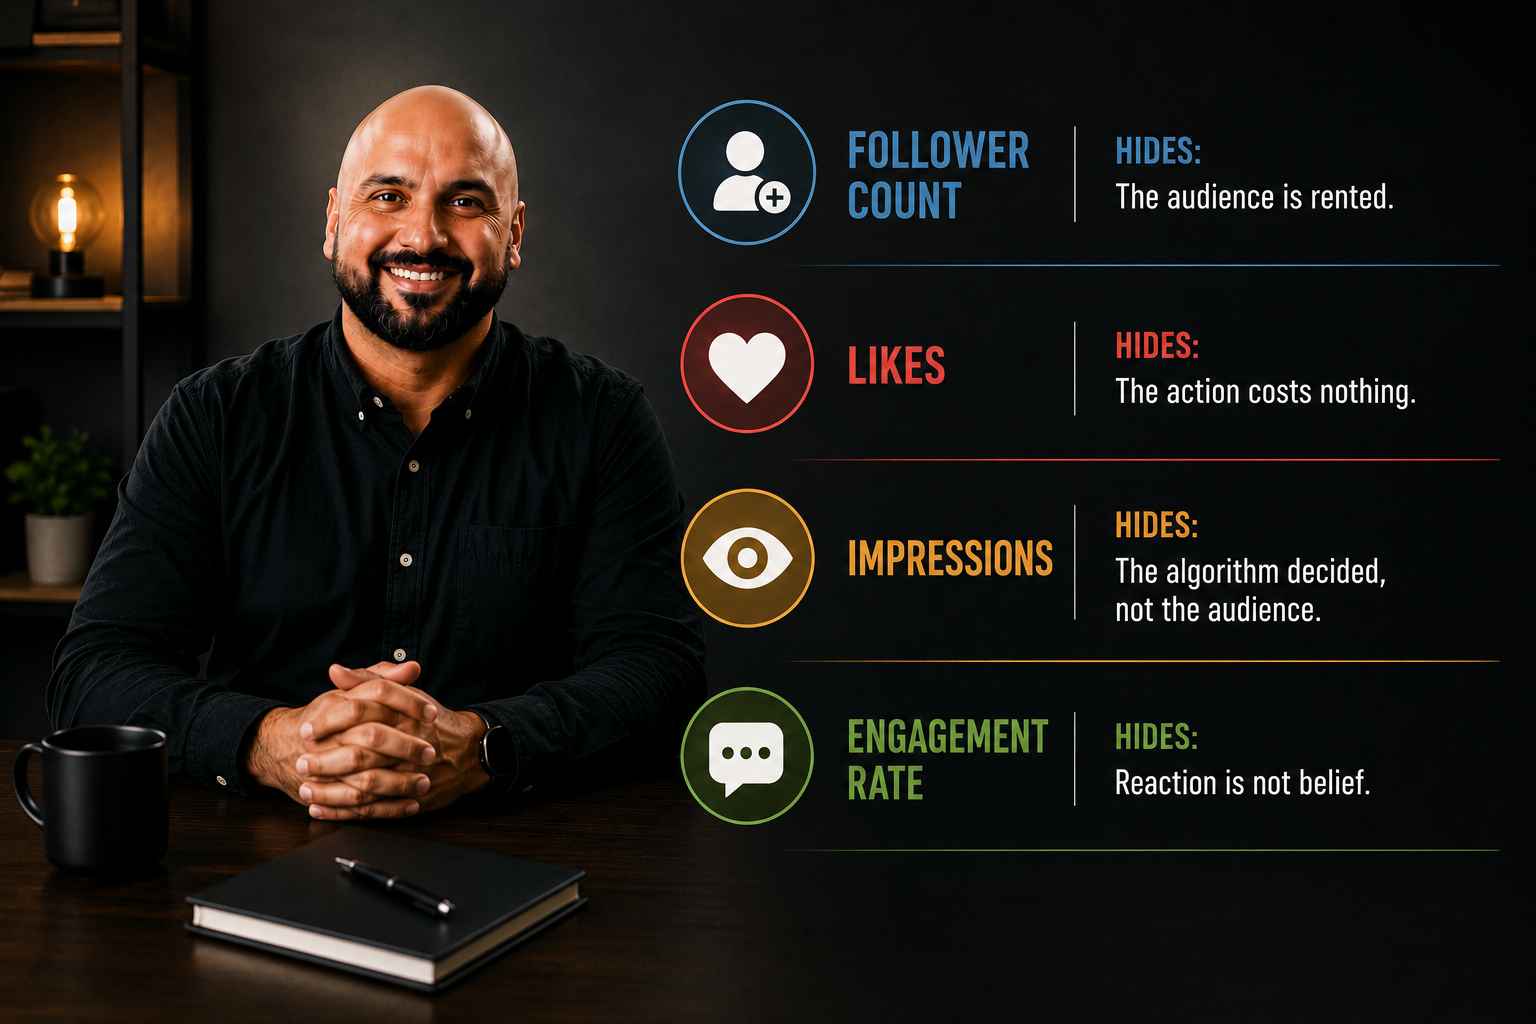
Each vanity metric hides a specific fiction. The four metrics and their fictions are given below:
Follower count hides that the audience is rented. The platform owns the relationship, prices the access, and changes the terms without notice.
Likes hide that the action costs nothing. A like records half a second of approval and zero intention.
Impressions hide that the algorithm decided, not the audience. The number reports distribution mood, never demand.
Engagement rate hides that reaction is not belief. An audience trained to react is not an audience prepared to buy.
The pattern across all four is identical: the number measures noise the platform generates and founders mistake for signal the market sends.
ROAC Replaces the Dashboard With Three Questions
ROAC, Return on Attention Created, the framework from GURU, INC. by AJ Kumar, replaces the vanity dashboard with three questions per piece of content.
Did the attention build identity, the association with one clear authority?
Did it earn trust, the belief that moves a viewer toward action?
Did it create leverage, the compounding inbound that keeps arriving?
The canonical definitions live on the ROAC page, and the full six-step scoring process lives in how to measure ROAC.
The replacement changes founder behavior within one quarter. Content built for engagement chases reaction. Content built for ROAC argues a position, earns belief, and compounds.
Running the first ROAC audit across an existing content library is where personal brand consulting for founders begins, because the audit shows exactly which attention was noise and which attention was quietly building the business.
Engagement rate and follower counts measure the reaction an algorithm rewards. ROAC measures the belief a business banks: identity, trust, and leverage value. The correlation between audience size and return sits near zero. Reaction is the noise. Belief is the signal.
Is a High Engagement Rate Ever a Good Sign
High engagement works as an early distribution signal inside the platform, and comments carrying real intent, questions, objections, and buying language, mark genuine interest. The rate becomes a lie only when founders treat it as a revenue predictor instead of a feed mechanic.
What Metrics Replace Vanity Metrics for Founders
Founders replace vanity metrics with outcome signals: audience members repeating the position in their own words, inbound calls citing specific content, and inquiries arriving months after publication. Each signal maps to one ROAC value: identity, trust, and leverage.
Why Do Small Accounts Outperform Large Accounts in Revenue
Small accounts concentrate trust. An audience built around one position holds a higher share of genuine buyers than a large audience assembled through trends. Return follows trust density, never headcount, which the near-zero follower correlation confirms.
What Numbers Belong in a Founder's Content Report
A founder's content report tracks banked outcomes: inbound inquiries and their sources, calls booked citing content, position repetition in comments, and inquiries arriving from months-old pieces. Platform numbers appear as context, never as the verdict.